> ## Documentation Index
> Fetch the complete documentation index at: https://docs.observability.platform.ai71services.ai/llms.txt
> Use this file to discover all available pages before exploring further.
# Features
## Current Features
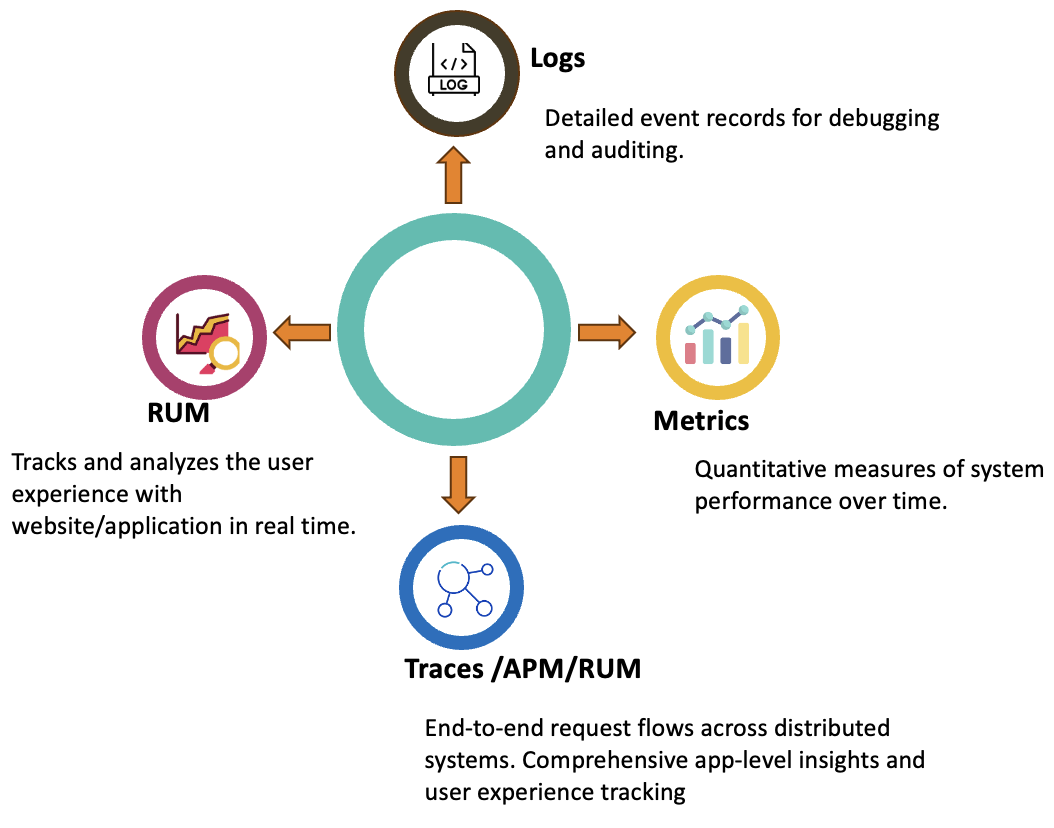
- Logs: Time-stamped records of discrete events. Logs provide detailed context and are essential for debugging and troubleshooting. Examples include application logs, system logs, and audit logs.
- Metrics: Numerical measurements of system behavior over time. Metrics provide aggregated data and are useful for identifying trends and anomalies. Examples include CPU usage, memory consumption, request latency, and error rates.
- RUM:Realtime User Experience - tracks and analyzes the behavior and experiences of users interacting with a website or application in real time. Tracks user journey tracking, performance metrics, geographical, browser and device level analysis.
 ## Roadmap
This section provides a detailed, quarter-wise breakdown of our plans for the upcoming year. It highlights key initiatives,
feature releases, and platform improvements we aim to deliver in 2025.
The Roadmap will be constantly reviewed to ensure delivery inline with product development roadmaps.
Set up dynamic alert thresholds based on predictive patterns rather than static values.
Configure granular access controls for different teams using Kibana Spaces.
Embed ELK monitoring into the CI/CD pipeline for real-time build and deployment tracking.
Integrate traces, logs, and metrics to provide a holistic view of system performance and troubleshooting.
Analyze user session details alongside RUM data for deeper insights.
Automatically sanitize logs to remove sensitive or unnecessary information before indexing.
Integrate traces, logs, and metrics to provide a holistic view of system performance and troubleshooting.
Implement predictive insights for system capacity planning and performance trends.
Leverage AI models to identify the root causes of incidents and suggest potential resolutions.
Automate remediation processes for recurring issues detected by ELK.
Use ML-based models to automatically detect anomalies in logs and metrics.
## Roadmap
This section provides a detailed, quarter-wise breakdown of our plans for the upcoming year. It highlights key initiatives,
feature releases, and platform improvements we aim to deliver in 2025.
The Roadmap will be constantly reviewed to ensure delivery inline with product development roadmaps.
Set up dynamic alert thresholds based on predictive patterns rather than static values.
Configure granular access controls for different teams using Kibana Spaces.
Embed ELK monitoring into the CI/CD pipeline for real-time build and deployment tracking.
Integrate traces, logs, and metrics to provide a holistic view of system performance and troubleshooting.
Analyze user session details alongside RUM data for deeper insights.
Automatically sanitize logs to remove sensitive or unnecessary information before indexing.
Integrate traces, logs, and metrics to provide a holistic view of system performance and troubleshooting.
Implement predictive insights for system capacity planning and performance trends.
Leverage AI models to identify the root causes of incidents and suggest potential resolutions.
Automate remediation processes for recurring issues detected by ELK.
Use ML-based models to automatically detect anomalies in logs and metrics.